


Principal component analysis (PCA)
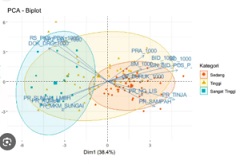
Principal Component Analysis (PCA) can be used to determine the relationship between water physicochemical parameters. Water physicochemical parameters are viewed based on depth, salinity, temperature, brightness, pH, dissolved oxygen (DO), organic C (in sediment), orthophosphate (in water column and sediment), nitrate (in water column and sediment), ammonia ( in water column and sediment)) and also to see if there is any grouping between stations based on these parameters.
Principal component analysis (PCOM) is used for the following reasons:
- Studying a data table/matrix from the perspective of similarities between individuals (rows) and variations (columns).
- Extracting important information contained in a large data table/matrix.
- Produces a graphical representation that facilitates interpretation.
AKU is a descriptive statistical method that aims to display in graphic form, the maximum information contained in a data matrix (Afifi and Clark, 1996). The data matrix in question consists of observation stations as statistical individuals (rows) and water physical-chemical factors as quantitative variations (columns).
The measured physicochemical parameters of the water do not have the same units, therefore in AKU the data needs to be equalized through centralization and reduction. Thus, the analysis results are not generated from the initial parameter values but from the synthetic index obtained from a linear combination of the initial parameter values .
IF is a method to break or divide a matrix of similarities into factorial axes. The obtained factorial axes can be interpreted as correlations with the original variations. Each axis corresponds to a characteristic root of the matrix. The characteristic roots help quantify the portion of information explained by each axis. From these characteristics of roots, the number of axes to be evaluated can be determined. The characteristic roots of the matrix of similarities are transformed into class derivatives, where the corresponding axes (components) are displayed in successively larger order to minimize the number of variations in the matrix.
Determination of centralization and reduction is done by:
- The center value is the difference between the initial parameter value and the average parameter value.
Center (C) = Xi – X
- The reduction value is the result of dividing the value of the parameter that has been centered by the standard deviation value of that parameter.
Reduction (R) = C : Sd
R : Reduction Value
C : Initial parameter value
Sd : Standard deviation value of the parameter
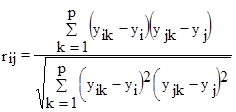
To determine the relationship between two parameters, a correlation matrix approach is used which is calculated from synthetic indices:
: Correlation matrix;
: Synthetic Index Matrix;
: Transpose matrix;
The linear correlation between two parameters calculated from the synthetic index is the normalized (centered and reduced) covariance of the two parameters. The general form of the linear coefficient used (also called the Pearson coefficient) is based on the function (Legendre and Legendre, 1983).
The graphs displayed can be translated with the following references (Hofman, 2000; Sartono, 2001):
- The length of a variable vector is proportional to the diversity of the variables. The longer the vector of a variable, the higher the diversity of the variable.
- The cosine value of the angle between two variable vectors describes the correlation of the two variables. The narrower the angle made between the two variables, the more positive the correlation. If the angle made between the two variables is perpendicular, the correlation between the two is low. Meanwhile, if the angle is obtuse (in the opposite direction) then the correlation is negative.
- The position of an object in the same direction as a variable vector is interpreted as the magnitude of the variable value for the object in the same direction. The closer the object is to the direction indicated by a variable, the higher the role of the variable for that object. Meanwhile, if the direction is opposite, the value is low.
- The proximity of the location/position of two objects is interpreted as the similarity of the properties of the two objects. The closer the location of two objects, the more similar the properties indicated by the variable values.